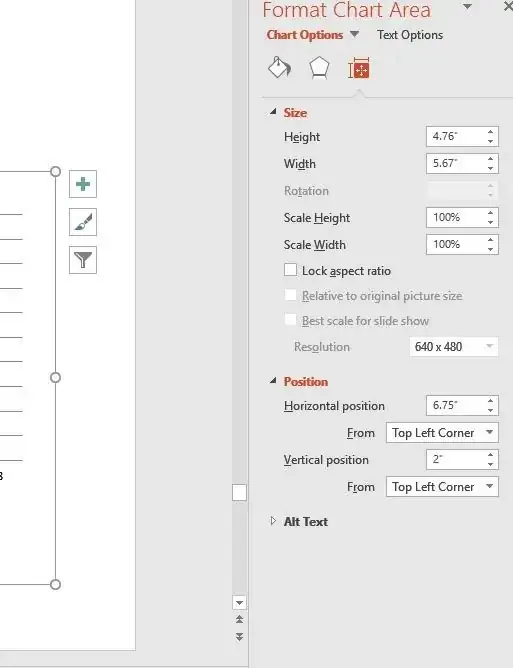
When I highlight a chart area, I get these options:
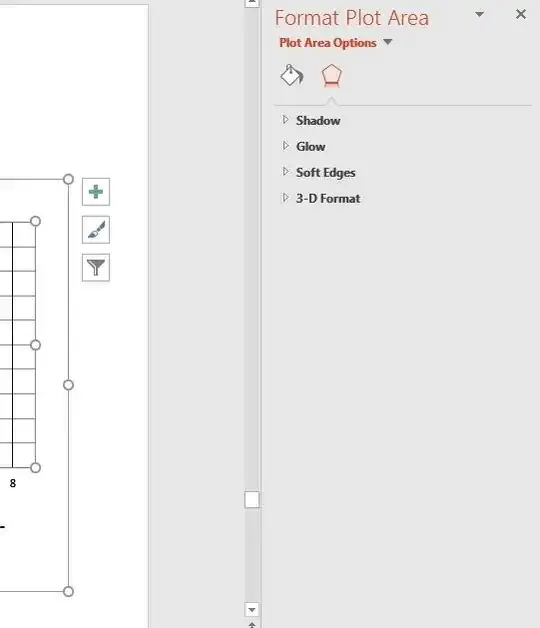
However, when I highlight a plot area, I don't get the "size & properties" options any longer:
My issue is that I have the same type of chart with different data on several slides and the height and width of all the plot areas is inconsistent (however, the chart areas all have the same size & position).
How can I adjust the plot areas exactly (with numbers), rather than having to eyeball them?

