2

I think I'm getting slowness due to running out of memory and hitting swap. I've watched the hardfaults/sec in Resource Monitor and it's often over 1000. This is an issue generally during recompilations, but also when my source code editor does something intensive.

But that 1000 just an absolute number, and I'm unsure whether that's my issue or not. SSD drives have fast random access so 1000 may be fine.

If I understand correctly, when a program accesses something not in main memory, it page faults, and retrieves that page from the disk.

It presumably then gives up control to another process.

So in theory, one could get lots of page faults without it affecting throughput significantly, if there are other processes ready to run.

So what I really want to know is, what percentage of CPU time is where the processor is idle but there is at least one process waiting on swap?

Is there anything that produces that figure? I think that figure will give a good idea of how much a RAM upgrade would help. Alternatively, is there another way to measure this that's more informative that number of page faults per second?
phuclv
  • 30,396
  • 15
  • 136
  • 260
Clinton
  • 123

1 Answers1

1

Indeed 1000 is just an absolute number

If your Pages Input/sec counter shows a value of 20 or greater for a slow disk and/or your Pages/sec counter consistently shows more than 40 pages per second on a slow disk or 300 per second on a fast disk, you can solve this issue simply by adding more memory to your server.

Pages Per Second Counters

but 1000 hardfaults/s is around 4MB of traffic each second, and IO rate at ~1000 IOPS. Since SSDs are typically rated at 50000 IOPS (or even millions of IOPS for high-end drives), this shouldn't be a problem on a modern system during a short compilation IMO

Therefore, we recommend that you monitor the disk performance of the logical disks that host a page file in correlation with these counters. Be aware that a system that has a sustained 100 hard page faults per second experiences 400 KB per second disk transfers. Most 7,200 RPM disk drives can handle about 5 MB per second at an IO size of 16 KB or 800 KB per second at an IO size of 4 KB. No performance counter directly measures which logical disk the hard page faults are resolved for.

\Memory\Page/sec and other hard page fault counters

You don't actually need to know how much time is spent for paging, but should check if the disk is saturated with IOs by checking Physical Disk\%Disk Time and Physical Disk\Avg Disk Queue Length in Performance monitor (the same app that was used to check for number of hard faults/sec). If it isn't or the disk active time is low then it's probably OK. You should also monitor Paging File\%Usage to see how much of the page file is used, if it's too much then you really need more RAM

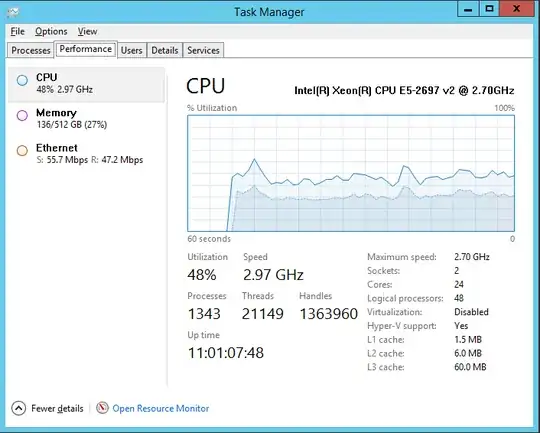
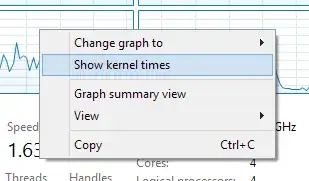
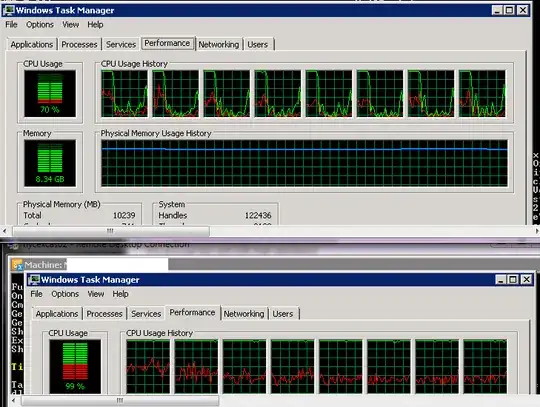
Nevertheless the most reliable method is probably to check the kernel time in task manager. You may need to right click and check Show kernel times to view it. In older task manager it's the red part and nowadays it's the dark area. If the kernel takes a high percentage of the CPU usage then it's a real issue. Those kernel times may be due to too much time reading/writing page file, or any other things in kernel space

Task Manager - Show kernel times

Classic Task Manager - Kernel CPU usage

Modern Task Manager - Kernel CPU usage

Further reading

phuclv
  • 30,396
  • 15
  • 136
  • 260