0

We can easily make an Excel table into a heatmap by applying a conditional formatting rule on the rectangle of relevant data cells. And - this can also be done for a PivotTable.

However, whenever you update the PivotTable - the conditional formatting rule is deleted (at least - in my experience).

How can I make my PivotTable be a heatmap, persistently?
einpoklum
  • 10,666

1 Answers1

0

I think you can edit the rule

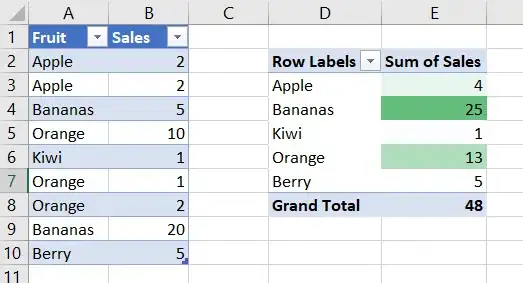
Original Data and Pivot:

enter image description here

Here's what happens if you add a new type of fruit and refresh the pivot:

enter image description here

As you noted, the conditional formatting does not apply to the newly added row in the Pivot Table. The value of 5 for Berry is not formatted.

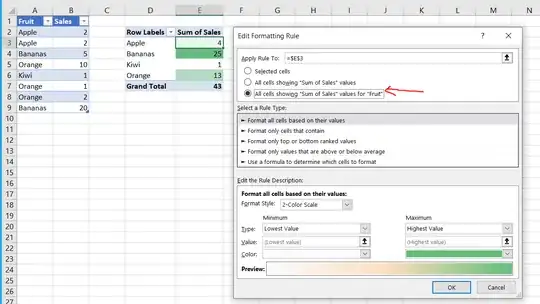
Let's edit the conditional format rule, changing the Apply To section to "All Cells showing Sum of Sales for Fruit".

enter image description here

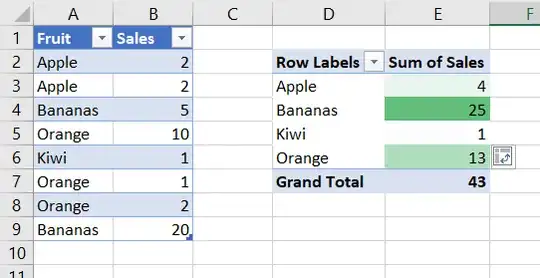
Now add more data and refresh the pivot, and it works!

enter image description here

Isolated
  • 1,535
  • 1
  • 5
  • 6