I'm a heavy Chrome user for development, and wanted to try out Safari, but how do I get the console to see my traces and other outputs?
I'm a heavy Chrome user for development, and wanted to try out Safari, but how do I get the console to see my traces and other outputs?
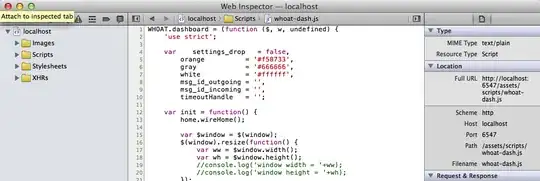
With the Web Inspector pane open and focused, click on the "speech bubble" icon above the left-hand pane, or press Control-8.
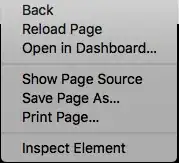
Update: Or, whether the Web Inspector pane is open or not, press Option-Command-C; or, if you have made the Developer menu visible in Safari's preferences, drop down "Develop" and choose "Show Error Console".
The other answers are fine, but for prosperity (Google search completeness...): on Mac OSX you open Chrome developer tools with Option+Cmd+I (or Option+Cmd+J to go directly to the JavaScript Console). With Safari it is Option+Cmd+C.
To enable the Developer Tools in Safari:
Press Option+Cmd+C to open the developer tools window, similar to Chrome's...
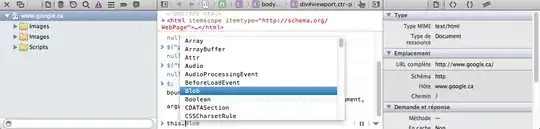
For me, the Safari JavaScript console seems to be a bit better than Chrome on a Mac for debugging AngularJS module loading errors :-)
From Apple's Using the Console to Debug JavaScript in Safari:
You can also press the Esc key anywhere in Web Inspector to move focus to the Quick Console in the bottom bar.


 ]
]