6

I have made a chart in excel in which I would like to hide the data label if value is zero. For data labels that contain the value itself this is done by using custom formating as explained here How can I hide 0-value data labels in an Excel Chart?.

However this doesn't work if the data label doesn't contain the value itself but the series name. Is there a way to hide the data label containing the series name if the value is zero?

3 Answers3

4

I think this falls into the world of VBA. Working on individual data labels is fairly limited otherwise.

Here is code that will iterate through the series in a chart, their data points, and then delete those labels which correspond to a point with Value=0.

There is a line of code in there (commented) that will add the data labels again to all of the points to reset them. If you just want to delete, then you can skip this line.

Edit: added in an outer loop on ActiveSheet.ChartObjects in order to process all of the charts on a sheet.

Sub RemoveZeroValueDataLabel()

    'runs through every chart on the ActiveSheet
    Dim cht As Chart
    Dim chtObj As ChartObject

    For Each chtObj In ActiveSheet.ChartObjects
        Set cht = chtObj.Chart

        Dim ser As Series
        For Each ser In cht.SeriesCollection

            Dim vals As Variant
            vals = ser.Values

            'include this line if you want to reestablish labels before deleting
            ser.ApplyDataLabels xlDataLabelsShowLabel, , , , True, False, False, False, False

            'loop through values and delete 0-value labels
            Dim i As Integer
            For i = LBound(vals) To UBound(vals)
                If vals(i) = 0 Then
                    With ser.Points(i)
                        If .HasDataLabel Then
                            .DataLabel.Delete
                        End If
                    End With
                End If
            Next i
        Next ser
    Next chtObj
End Sub

This answer grabs Values from the Series using the technique detailed here.

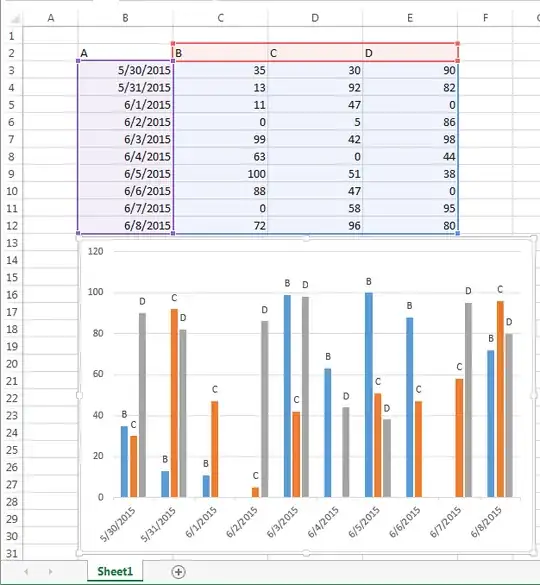
Here is the result on some random data where a couple of 0 value bars have had their data labels deleted.

chart with labels deleted

0

You could apply a custom formatting code to your labels, which is the same kind of code that is used to format numeric cells (date, percentage, currency, etc.). Custom format code has the following syntax:

<positive>[;<negative>[;<zero>[;<nan>]]]

You need to copy the existing format code two times (separated by ;), and then put an extra ; behind, which would mean an empty string if the value is zero. For example, if your labels are formatted as percentage, you will see the code

0%

for a currency format the code would be

$#,##0

Corresponding codes with empty strings for zero values are

0%;0%;
$#,##0;$#,##0;

respectively.

As a side note, custom formatting codes are often used to apply different colors to positive/negative numbers, as described here.

-1

You could delete all your 0s (Find and Replace to replace all your 0s with a true blank matching entire cell content, ="" doesn't work).

enter image description here

selwyth
  • 124